Dashboard
This article explains how to navigate and utilize the Dashboard. It presents key information highlights.
The Dashboard provides administrators and managers with insights into Vipilink features, offering a visual representation of usage metrics such as active sessions, member licenses, gateway licenses, and configured Zero Trust Applications.
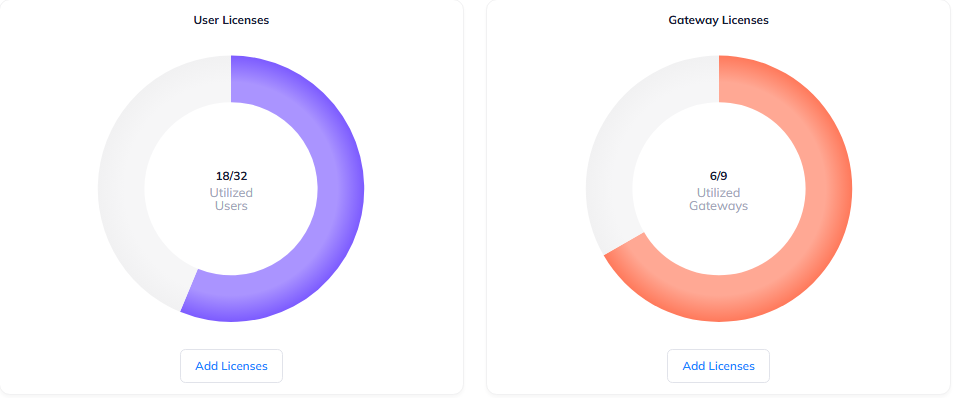
User Licenses and Gateway Licenses
You can access utilization details for user and gateway licenses. There is an option to add licenses directly from this menu.
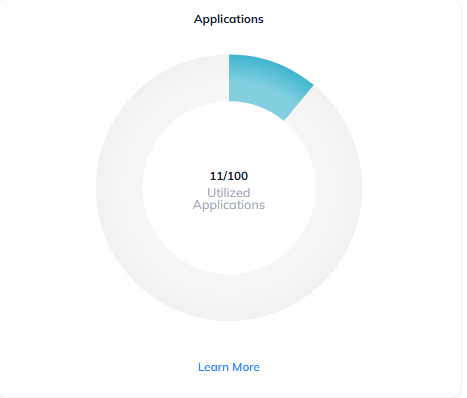
Applications
View utilization details for Zero Trust Applications.
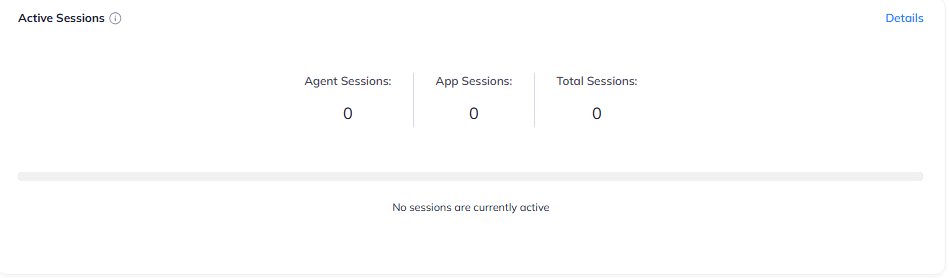
Active Sessions
Monitor real-time data on active sessions across locations, agents, and applications. Each user connected through an agent or a Zero Trust Application is considered a session.
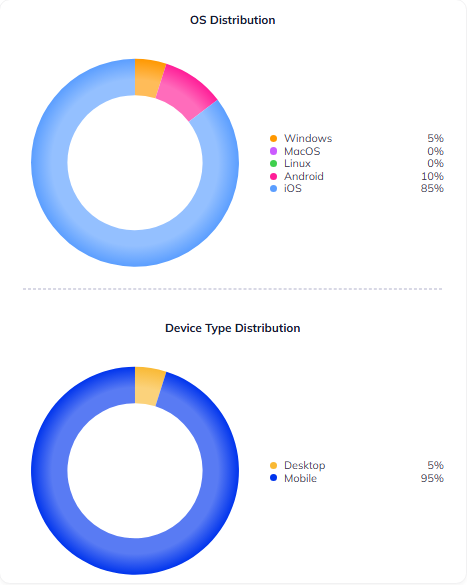
OS Distribution and Device Type Distribution
OS Distribution displays the percentage of operating systems in use, including iOS, Android, Linux, macOS, and Windows, while Device Type Distribution shows the percentage of users on desktop versus mobile devices.
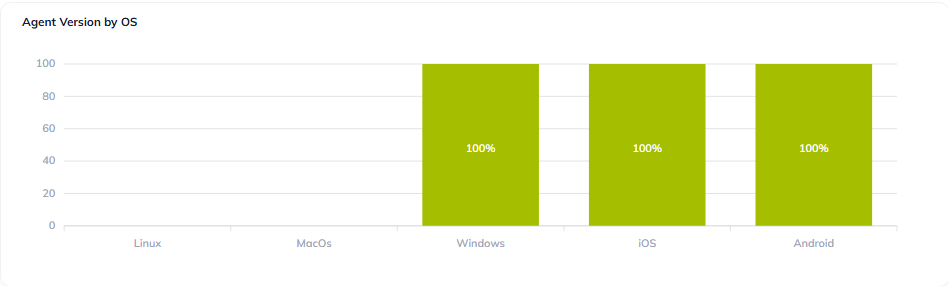
Agent Version by OS
It displays the version in use, categorized by operating system.
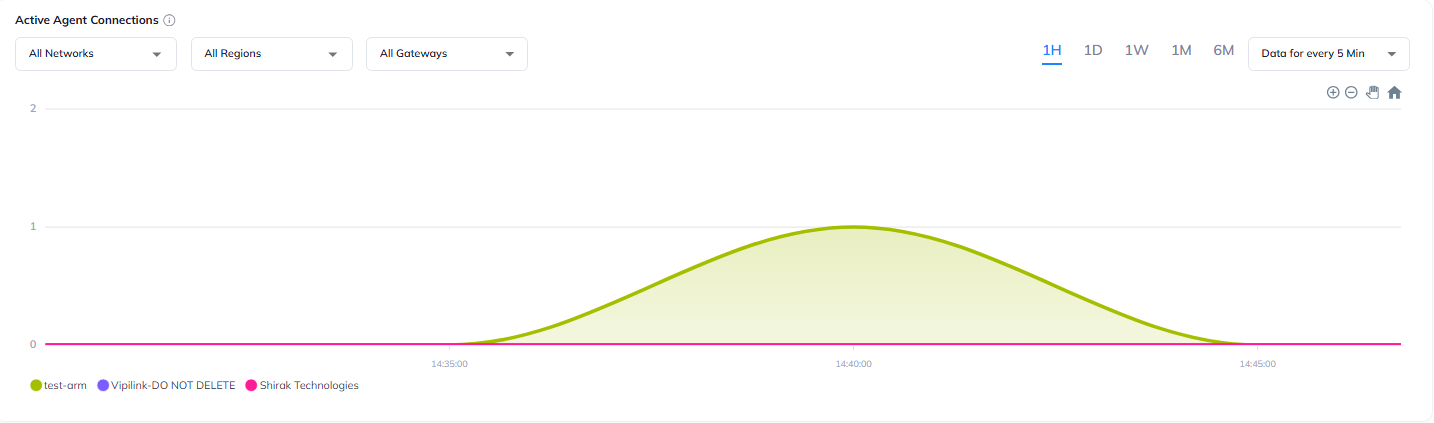
Active Agent Connections
Monitor both real-time and past data on users connecting through the agent and active on your networks. You can filter the view based on network type, region, gateway, timeframe, and scale.
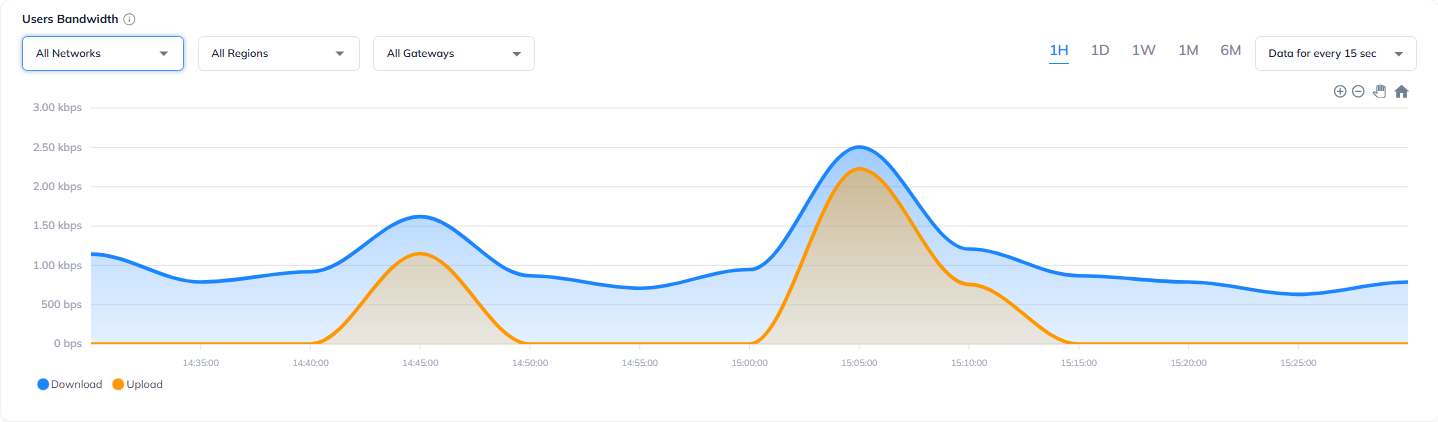
Users Bandwidth
Monitor real-time and past bandwidth usage of gateways for users connecting via agents. You can filter the view based on network type, region, gateway, timeframe, and scale.